
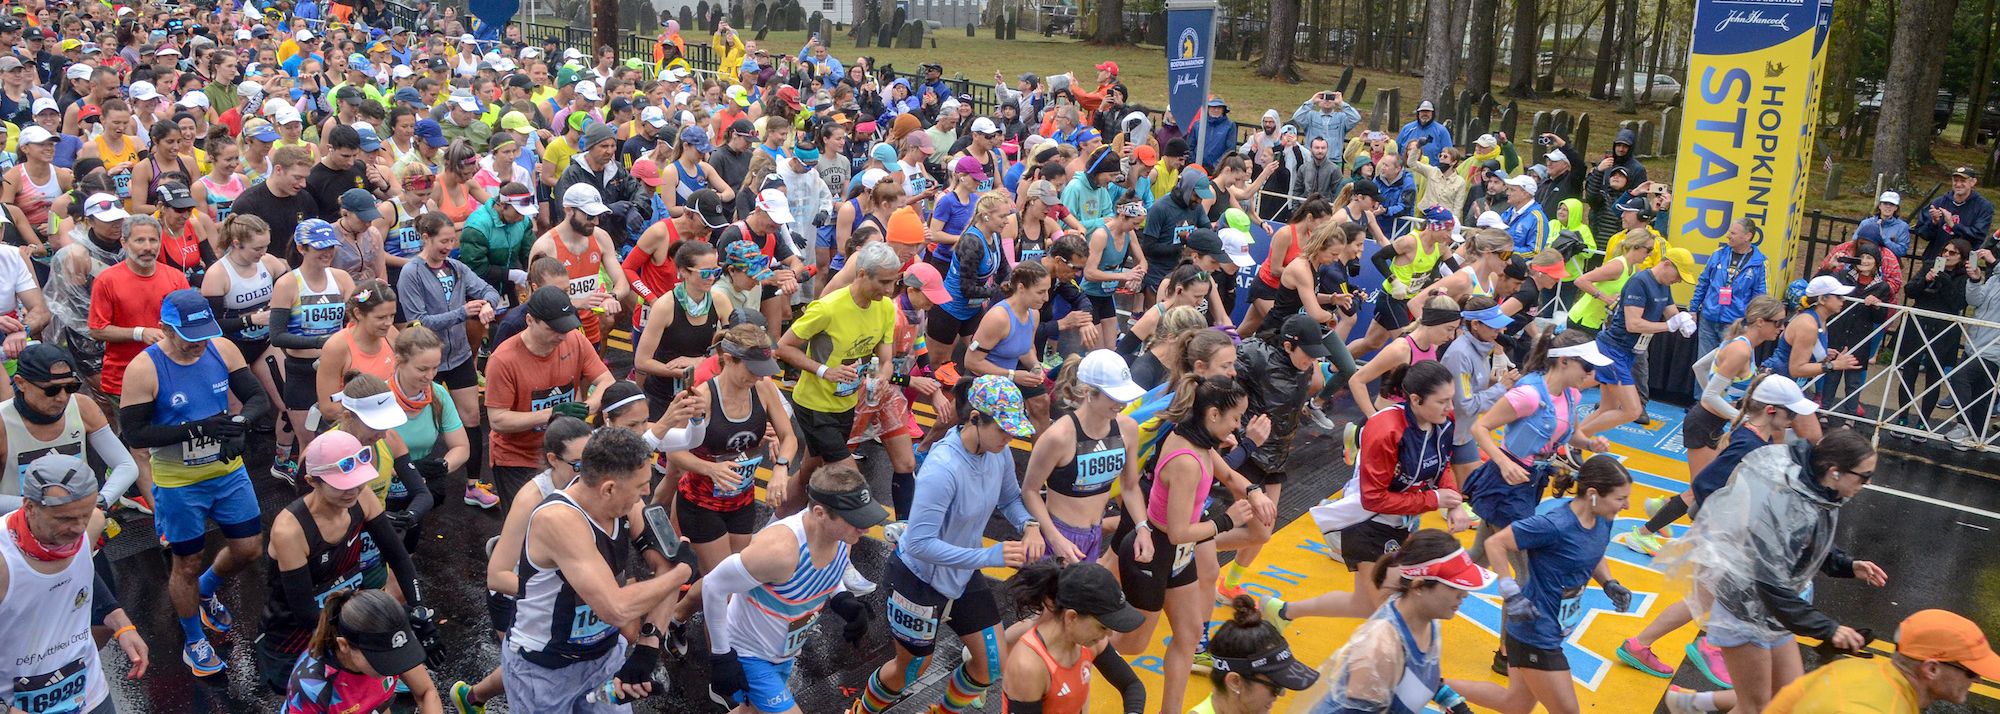


Boston Marathon start
Not only elite athletes align on the prestigious majors. They usually gather people from the whole world, ready to face the emblematic distance for the first time, break their personal bests or yet, live a unique moment in a great city and its festive atmosphere.
While majors have restricted access, the ballot policy allows runners of all levels to participate as seen from time distributions below.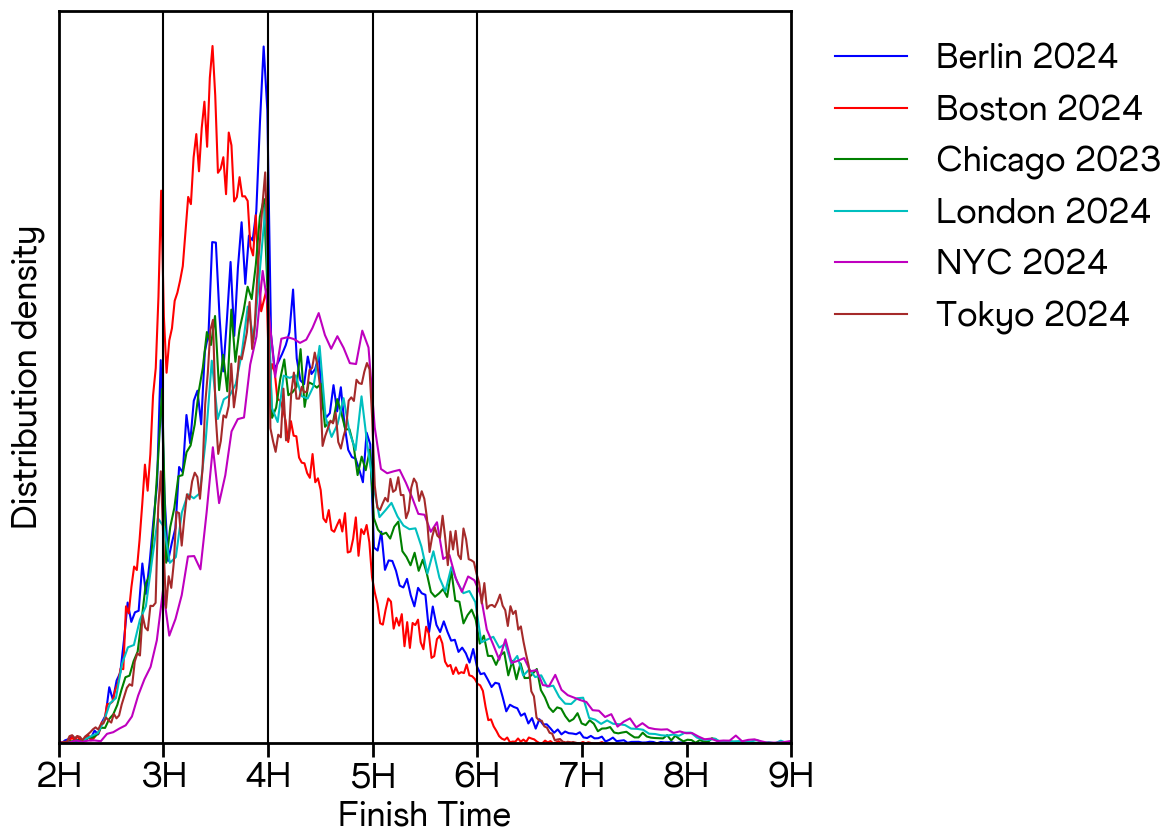
Figure: Finishing time distribution for recreational athletes on the 6 world major marathons. The color refers to each event.
Boston's selection policy for elite runners is clear here, with the highest median finish time of about 3:43. Interestingly, amateur runners complete the Berlin Marathon faster than Chicago (median times of 4:02 versus 4:12). In particular, Germany sees fewer finishers above 5 hours compared to Illinois.
London and Tokyo show similar profiles, consistent with the winners' times presented earlier, with median times around 4:20. The New York City Marathon is more challenging, with a wider distribution and a median finish time of 4:32.
The vertical lines on the graph show common time barriers (3:00, 3:30, 4:00, etc.) that runners typically aim for. These barriers create noticeable peaks in the distribution, with the most pronounced peaks appearing in Boston, Berlin, and Chicago. In contrast, the NYC Marathon shows a more continuous time distribution, suggesting it's not the ideal course for achieving personal best times.
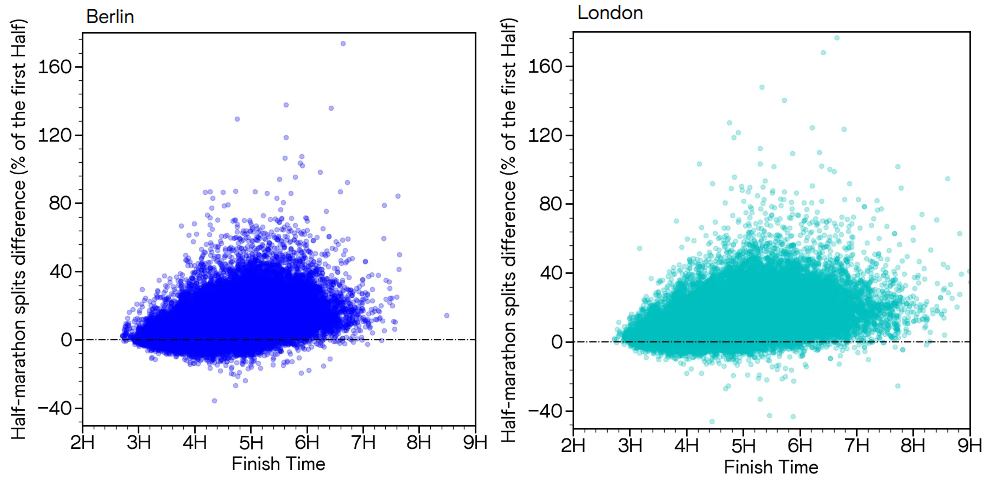
Figures: Percentage difference between the second and first half-marathon times as a function of finish time. The black dashed line indicates equal splits—above shows positive splits, below shows negative splits.
Below 3 hours, athletes are experienced runners who maintain more consistent pacing with nearly equal splits. Beyond 6 hours, most participants simply aim to complete the race. In the middle range, we find the majority of runners, with a notable performance drop between the 3-4 hour target times, resulting in 4-6 hour finish times—a phenomenon commonly known as "hitting the wall".
| City | Tokyo 2024 | Boston 2024 | London 2024 | Berlin 2024 | Chicago 2023 | New York 2023 |
|---|---|---|---|---|---|---|
| % of negative splits | 8.74 | 2.47 | 8.31 | 16.56 | 14.63 | 5.12 |
Table: Percentage of runners achieving negative splits (faster second half) across the six major marathons.
With around 15% of participants achieving negative splits, Chicago's performance matches Berlin's. Although Berlin experienced high humidity in 2024, it didn't significantly impact athletes' performance. This may be due to the moderate temperature of 8-9°C, which made the humidity more manageable. Similarly, Tokyo's dry conditions in 2024 had little effect on athletes' performance, with the peloton performing comparably to London—reflected in their similar median times.
As expected from the course profiles, Boston's strong downhill makes it the most challenging venue for achieving negative splits. New York City also proves difficult for participants due to its rolling hills. In contrast, Chicago's flat terrain provides excellent conditions for runners to maintain steady pacing, similar to Berlin where the occasional hill doesn't significantly impact mass runners' strategy.
Boston: a very special event
Given its unique profile and our previous analysis, the Boston Marathon stands out as a distinctive event. With its rigorous qualification standards and historic course design, it provides an excellent case study for examining how climate conditions affect marathon performance.
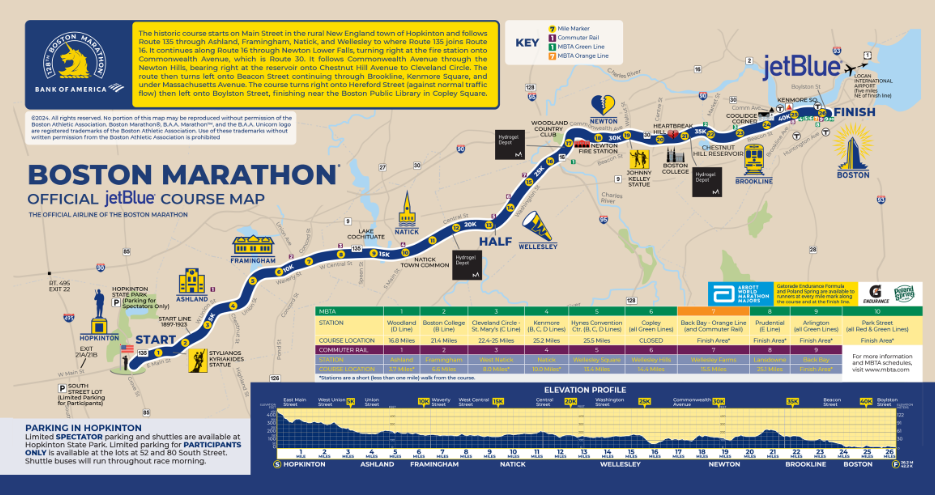
Figure: Official description of the Boston Marathon (https://www.baa.org/races/boston-marathon/enter/course-information).
Runners start in Hopkinton towards Boston from West to North East in a straight line.
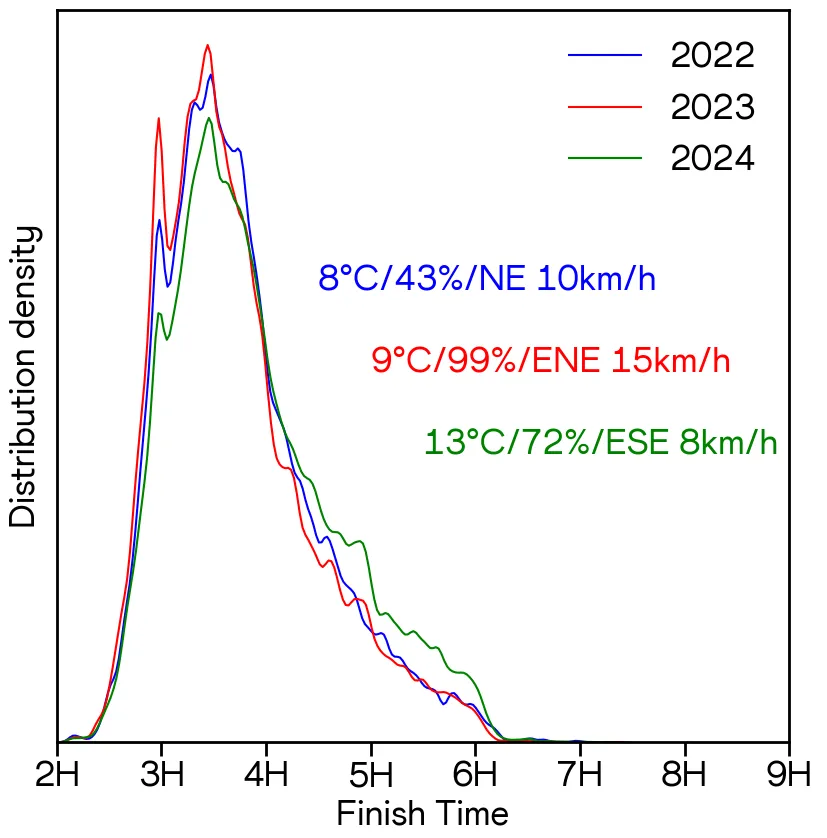
Figure: Distribution of finish time in Boston marathon in 2022, 2023 and 2024 with climate conditions at start: temperature, humidity and wind direction and intensity.
The fastest median finish time among the three most recent editions (3:38, 3:34, and 3:43 respectively) occurred with an East/North-East wind facing the runners—a 15 km/h breeze at the start that diminished throughout the day. Runners seemed to appreciate the light rain that began after 11 AM. The 2022 edition provided excellent conditions for both participants and spectators, with sunny skies, minimal wind, and moderate temperatures. This contrasted sharply with the 2024 event, where runners faced challenging conditions with temperatures reaching 19°C and direct sun exposure. The 3-hour barrier proved especially difficult in 2024, despite implementing a stricter qualifying standard of 2:54:31 compared to the previous 3:00:00 requirement. Overall, only 2.5% of participants achieved negative splits in 2024, compared to 7.1% and 10.9% in previous years.
High humidity combined with mild temperatures appears to be more conducive to performance than dry conditions, as seen in 2022. Across these three editions, temperature clearly had the strongest influence on the performance of the peloton.
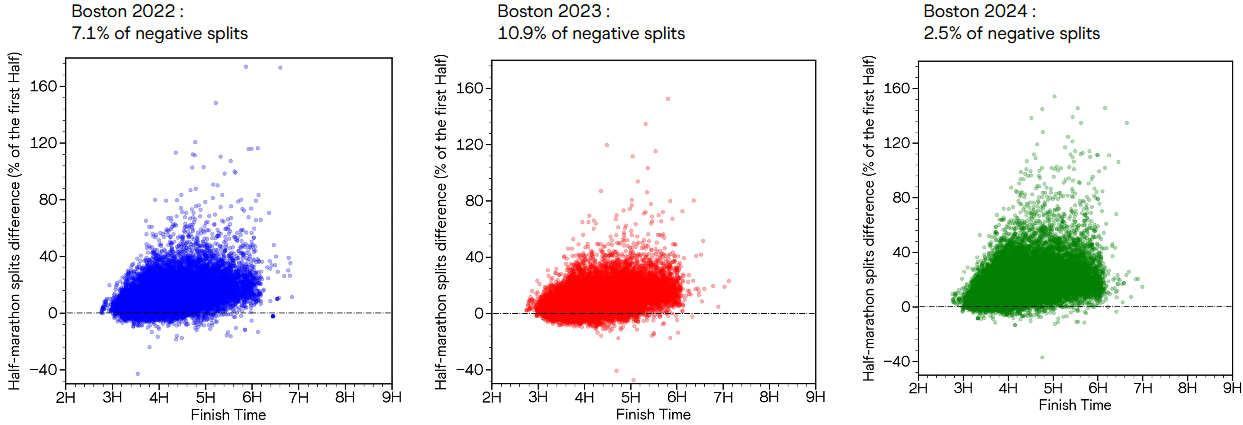
Figures: Percentage difference between the second and first half-marathon times as a function of finish time for the three last editions of the Boston marathon (respectively 2022, 2023 and 2024). The black dashed line indicates equal splits—above shows positive splits, below shows negative splits.
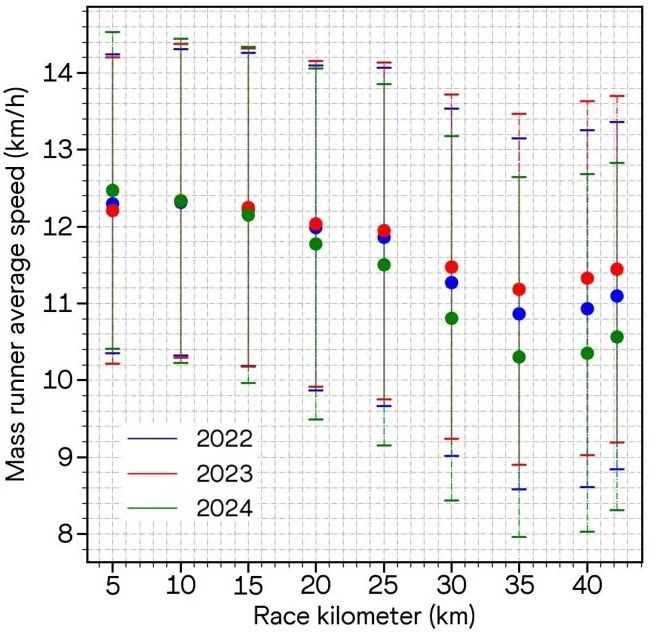
Figure: Evolution of the runner average speed in Boston marathon in the three last editions.
With the same course profile for all three races, the climate's effect is clear. Starting from the halfway point in 2024, most runners experienced a significant speed decline compared to previous editions. Higher temperatures caused an average running speed difference of more than 0.5 km/h between 2023 and 2024. Drier conditions led to a maximum decrease of 0.3 km/h between 2022 and 2023. Rather than adopting more positive split strategies, runners experienced a complete performance breakdown.
Optimal Performance: Coupling Flat Terrain and Favorable Climate
This study has provided valuable insights into how course profiles influence both elite and recreational athletes' races. However, it has also shown that for a given profile, race dynamics can be heavily influenced by uncontrollable factors such as humidity and temperature. Wind conditions also significantly impact athlete performance, particularly on courses like Boston's, where runners may face headwinds throughout the entire race.
This analysis highlighted that performance tends to improve in temperatures around 8 to 9°C, combined with humidity levels of 80% or higher. However, humidity appears to be a less influential factor compared to temperature. Among the World Marathon Majors, Berlin, Chicago, and Boston offer the best conditions for performance, thanks to their flat courses and timing that aligns with ideal weather. Meanwhile, New York, London, and Tokyo stand out for their unique courses and the extraordinary experience of racing in iconic and vibrant cities (not that the other three are any less remarkable!). The upcoming Sydney event promises to bring fresh perspectives to this reflection as the first Major held in Oceania.